Ticket to Ride Analytics
Exploration of board game strategy and analytics
During my time at the Bellingham T-Mobile Customer Experience Center, I developed a strong familiarity with performance dashboards and tools such as PowerBI. Working with these systems sparked a lasting interest in data analysis and pattern recognition, particularly in competitive high-variance environments.
Not interested in reading this? Skip to the cloneable and downloadables
From late June to early September, I ran a 50-game Ticket to Ride tournament with three family members, carefully recording core scoring data, including total points, route completions, and train usage. What began as a casual experiment to log final scores evolved into a structured analysis of variance, scoring patterns, and strategic tradeoffs in a semi-randomized board game environment.
Update: There is now a very basic data processing and analysis pipeline you can download and run as a Jupyter .ipynb file.
The Gamelog
Every game was recorded in a centralized log, capturing core performance metrics:
- Total points (final score per player)
- Train points (points from track placement)
- Route points (destination ticket points)
- Route quantity and completion rate (how many routes, completion rate as a percentage)
- Longest route bonus (attributed to only one player)
- Cars remaining (train cars remaining at the end of the game)
These metrics served as the dataset employed in further analysis.
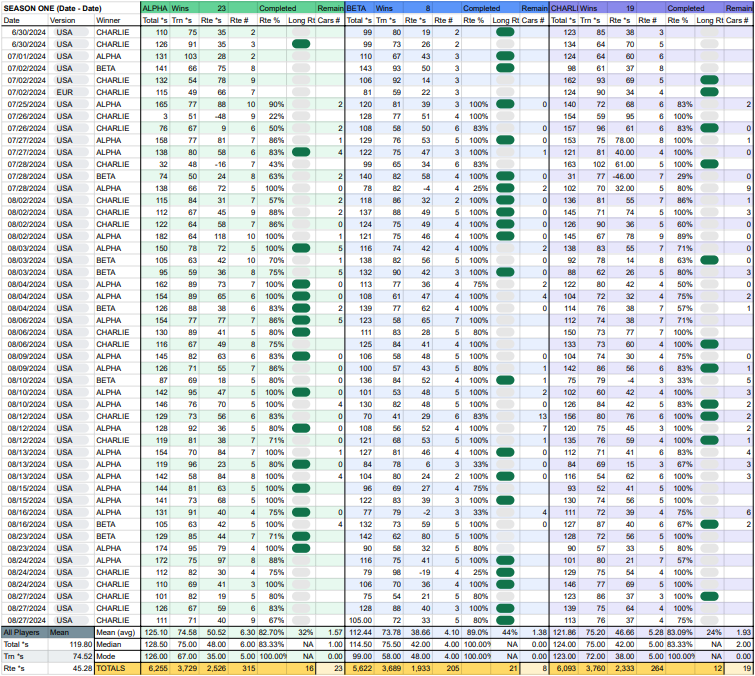
Gamelog - Season One PDF (where Noah = ALPHA and other players are anonymized)
Data Abstraction (Game/G-Analysis)
The Game Analysis sheet served as a staging ground for organizing and manipulating data drawn directly from the Gamelog. Keeping this process separate preserved the readability and integrity of the original dataset while enabling more flexible exploration. Data expressions derived here later feed into both the Player Analysis and Game Dashboard sheets.
Player Modeling (Player/P-Analysis)
What made the project most exciting for me was in building a player-specific performance dashboard. Drawing from the Gamelog and G-Analysis sheets, I created a structured set of interpretive questions designed to uncover how each player approached the game. Rather than focusing on gross totals and averages, this layer allowed for a deeper analytical view. How consistent was a player? Did they favor high-risk strategies, and if so, did those risks pay off? Were wins tied to specific patterns of point-earning behavior?
At the top of the sheet, core averages are displayed across all key metrics. Below, each category is broken down through statistical evaluations, including standard deviations, volatility, upside and downside deviations, and risk-adjusted performance ratios such as the Sharpe and Sortino ratios, adapted from financial modeling. Framing the analysis as a series of questions made the dashboard both intuitive and exploratory. It encouraged users to investigate not just how many points were scored, but how they were earned and how often players deviated from or exceeded their typical performance.
The result is a statistical fingerprint of each player's style. It provides a quantified view of consistency, variability, and strategic identity. It reveals not just who won, but how they won and why.
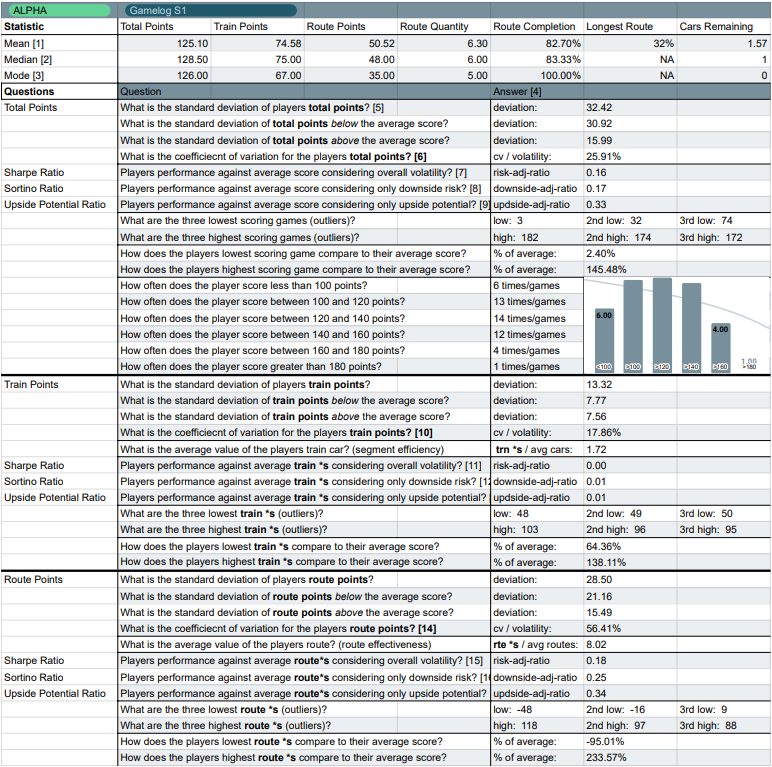
P-Analysis - Noah Williams PDF
Finally, Charts and Final Results! (Game/G-Dashboard)
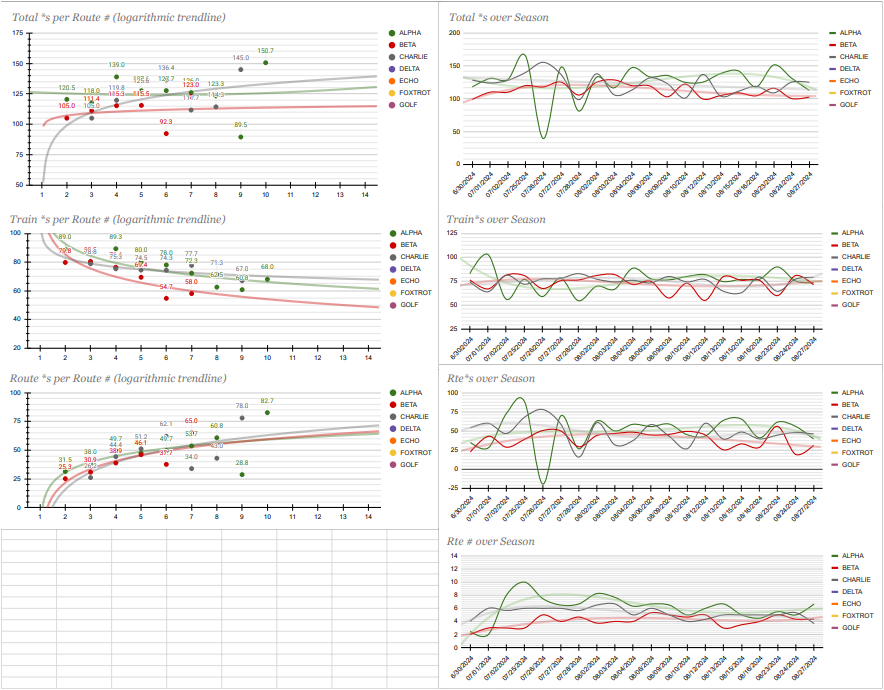
The G-Dashboard visualized player performance across all 50 games, highlighting how point totals, train scores, and route completions scaled with the number of tickets held. Logarithmic trendlines revealed nonlinear relationships, such as diminishing returns after a specific route count. Time-series charts captured changes over the season, making it easy to spot scoring streaks, shifts in strategy, and overall consistency.
By the end of the tournament, I had scored 6,255 points and won 23 games. My sister followed with 6,093 points and 19 wins, and my mom with 5,622 points and 8 wins. My highest-scoring game reached 182 points, achieved by completing 10 routes. On average, I played with 6.3 routes per game, completing over 82% of them.
Emergent Language and Strategies
One of the most interesting aspects of playing so many games was the emergent strategies and language that developed ideas and terms not found in the rulebook, but essential to understanding higher-level play:
- Card Pull Order: When drawing cards, unless there are two face-up cards you need or want, always draw one card from the random pile first. This gives you the advantage of seeing the first card before making your second decision. For example, if you're hoping for a white but know you also need a red, drawing a blue on your first pull might make the red face-up card the safer second choice. It also increases your chances of naturally drawing a wildcard (affectionately known as a trainbow), which can only be taken once from the face-up pile.
- "Counting" Cards: There are 12 of each colored card and 14 wildcards in the (USA version) deck. As players build trains and reveal what they've used, you can track what's been played, what's face-up, and what you've drawn yourself. This allows for deduction about what remains in the deck and can help guide your decisions about which routes to pursue or delay.
- Antifragile Pathing: Fragile paths can be easily disrupted when multiple players converge on the exact location. Identifying and securing these high-risk segments early became essential. Take Nashville to Atlanta, a one-segment connection that costs just 1 card. If blocked, the minimum alternative route jumps to 5 cards, then 8 on the next turn, and can climb to 10 or greater as pressure continues. The cost of missing that early claim escalates rapidly.
- Route Efficiency: We coined the term inefficiencies to describe unnecessary splits in train pathing. These deviations make it harder to claim the Longest Route bonus and generally reduce scoring potential. Optimal play balanced minimal branching with the ability to complete multiple destination tickets.
- Car Efficiency: Using fewer train cars to earn more points proved critical. The ability to complete routes with high-value segments preserved flexibility in the late game. Players who ran out of cars too early often missed out on significant opportunities.
- Gambling: Drawing destination tickets near the end of the game was dubbed gambling. Success depended on pulling routes you had already completed or could finish quickly. A lucky draw could offer a significant point boost, but a bad draw often led to a sharp penalty.
- Endgame Control: The player who places their final train car controls when the game ends. If you're ahead or have completed your objectives, ending the game early can prevent opponents from catching up. If you're behind, stalling becomes a tactic. Encouraging the player closest to finishing to take risks (i.e., to gamble) became a common and often successful form of psychological play.
- Point Targeting: Players often aimed to reach a specific threshold in one scoring category before shifting focus to another. My strategy was to secure at least 50 route points early, then pivot to building longer trains to maximize train point efficiency. This two-phase approach balanced risk and reward across the game.
- Mindreading: Familiarity with the 30 destination tickets in the U.S. version allowed for predictive thinking. By observing player movement and build patterns, you could reverse-engineer which tickets they likely held. This could be used to block opponents or to better time your route draws, assuming specific tickets were still available.
Clone this Project
If any part of this sounded fun, you can clone the full spreadsheet here and run your own tournament. Whether you're playing with friends or family, adding structure and analytics brings a new layer of strategy to Ticket to Ride. Tracking your games transforms casual play into an evolving system, one that you can measure, reflect on, and improve. It changes how you think about risk, how you read your opponents, and how you define a "good" game.
And let's be honest, who doesn't want to tell someone their Sharpe ratio is too low?
Links
TTR Tournament - Quick Start Guide
TTR Tournament - Clonable
TTR Tournament - Clonable w/Anonymized Sample Data
TTR Tournament - Drive Folder
TTR Tournament - Jupyter Pipeline
Project Summary
Role: Player, scribe, data analyst
Duration: Summer 2024
Tools Used: Google Sheets, Ticket to Ride calculator, Jupyter, pen and paper