Ticket to Ride Analytics
A 50-game family tournament that became an experiment in measurement, statistical modeling, strategy, and discovering structure in behavior.
In the summer of 2024, my family started playing a lot of Ticket to Ride.
I started keeping score.
Then I kept slightly more score.
By the end of the summer, we had played a 50-game tournament and I had built an increasingly unnecessary analytical system around it.
Part of the inspiration came from my previous work at the T-Mobile Customer Experience Center in Bellingham, where I had spent a lot of time around performance dashboards and tools such as Power BI. I liked the way a large number of individual actions could become legible when represented as data.
So I started treating the board game the same way.
From late June through early September, I played a 50-game tournament with two family members and recorded increasingly detailed information about each game. What began as a casual experiment in logging final scores gradually became an analysis of scoring patterns, variation, player behavior, and strategic tradeoffs in a semi-randomized environment.
The interesting part quickly stopped being who won.
I wanted to know how.
There is also a basic data-processing and analysis pipeline available as a Jupyter notebook in the project files.
The Gamelog
Every game was recorded in a centralized log containing the core performance measures for each player:
- Total points: final score
- Train points: points earned from placing trains
- Route points: destination-ticket points
- Route quantity: number of destination tickets attempted
- Route completion: percentage of destination tickets completed
- Longest route: whether the player received the bonus
- Cars remaining: train cars left at the end of the game
These measurements formed the raw dataset used throughout the rest of the project.
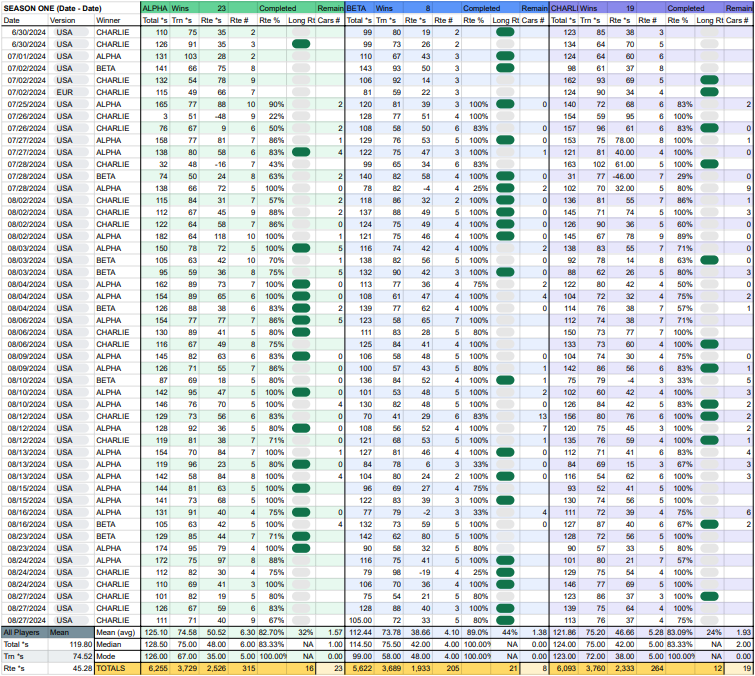
View the Season One Gamelog PDF
In the public version, I appear as ALPHA and the other players are anonymized.
Data Abstraction
I kept the raw Gamelog relatively clean and used a separate Game Analysis layer to organize and manipulate data derived from it.
That separation made it possible to experiment without turning the original dataset into an incomprehensible spreadsheet.
The resulting expressions then fed into two higher-level views: player modeling and the overall game dashboard.
Player Modeling
This became the part of the project that interested me most.
Players could arrive at similar final scores through very different strategies. One might pursue many destination tickets. Another might emphasize long, efficient train segments. Some players were remarkably consistent. Others produced much more volatile outcomes with a larger potential upside.
So rather than asking only how many points did this player score?, I started asking questions such as:
- How consistent was the player?
- Where did most of their points come from?
- How much did their performance vary from game to game?
- Did high-risk games actually produce higher rewards?
- Were wins associated with particular combinations of route and train scoring?
- How often did a player substantially outperform or underperform their typical game?
I experimented with standard deviation, volatility, upside and downside deviation, and even adapted measures such as the Sharpe and Sortino ratios from financial analysis to describe differences in player performance.
The result was something resembling a statistical fingerprint of each player's style.
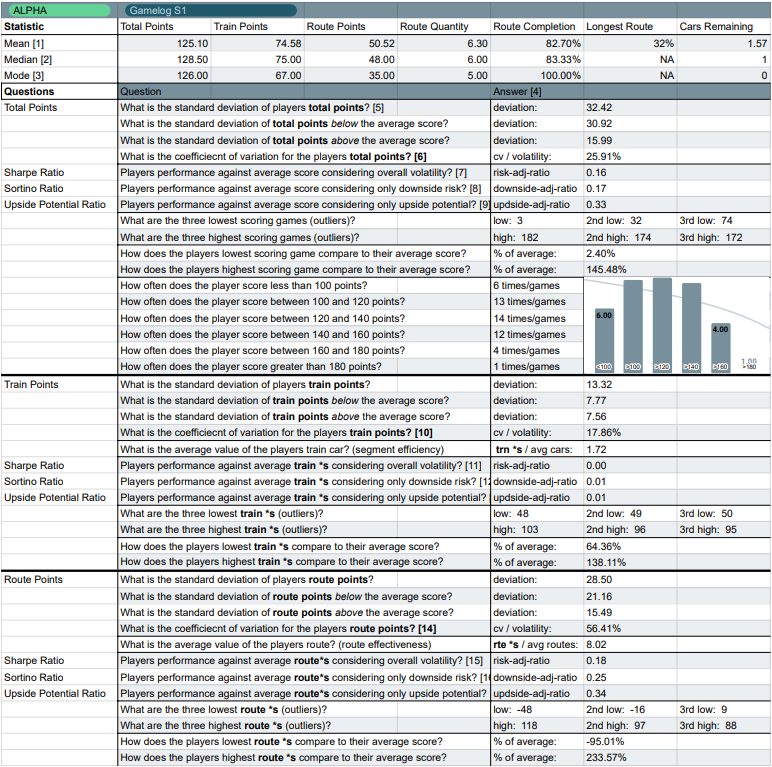
Game Dashboard and Final Results
The Game Dashboard visualized performance across all 50 games.
I used it to compare total scores, train points, route points, ticket quantities, completion rates, and changes in performance across the tournament. I also experimented with logarithmic trendlines to look for nonlinear relationships, including apparent diminishing returns from holding increasingly large numbers of destination tickets.
Time-series views made it possible to see winning streaks, changes in strategy, and differences in consistency between players.
By the end of the tournament:
- I scored 6,255 points and won 23 games
- My sister scored 6,093 points and won 19 games
- My mom scored 5,622 points and won 8 games
- My highest-scoring game was 182 points
- That game involved completing 10 destination tickets
- I averaged 6.3 destination tickets per game
- I completed more than 82% of the tickets I attempted
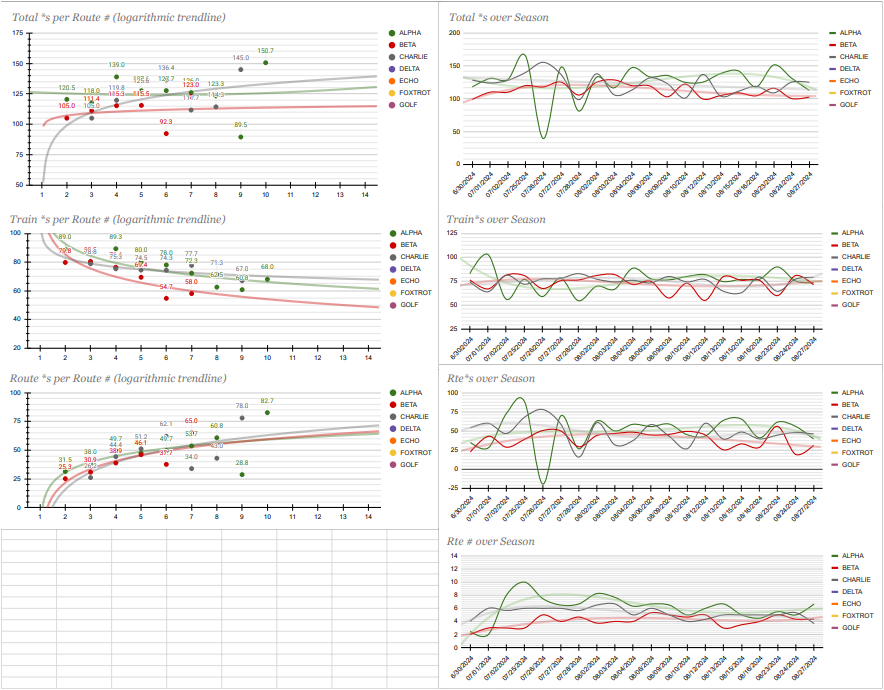
View the Season One Game Dashboard PDF
Emergent Strategies
Playing the same game 50 times also produced something that wasn't contained anywhere in the spreadsheet.
We developed our own language for describing patterns of play.
Card Pull Order
When drawing train cards, unless there were two face-up cards I specifically wanted, I generally drew from the random pile first.
That preserved more information for the second decision. If I wanted white cards but also needed red, for example, drawing an irrelevant blue card first might make taking a visible red card the safer second choice.
It also preserved the possibility of drawing a wildcard, affectionately known in our games as a trainbow, without sacrificing the option of taking a useful visible card afterward.
Counting Cards
There are 12 cards of each standard color and 14 wildcards in the U.S. version of the deck.
As players reveal cards by constructing routes, it becomes possible to keep a rough model of what has already been played, what remains visible, what you hold yourself, and therefore what is likely still somewhere in the deck.
We started informally counting cards to guide decisions about whether particular routes were still realistic.
Fragile and Antifragile Pathing
Some routes are much more vulnerable to interference than others.
Nashville to Atlanta, for example, is a one-car connection. If another player takes it, the alternative path immediately becomes substantially more expensive.
We started describing routes whose success depended heavily on one or two vulnerable segments as fragile paths.
An antifragile plan, in our informal vocabulary, was one that retained useful alternatives even when another player interfered with the original route.
Route Efficiency
We used inefficiencies to describe unnecessary branching in a player's network.
Excessive branching consumed train cars, complicated attempts to earn the Longest Route bonus, and often indicated that destination tickets were not being combined efficiently.
The ideal path completed multiple objectives while minimizing unnecessary deviation.
Car Efficiency
Train cars are a limited resource.
Longer segments generally produce more points per car, so the ability to complete useful routes through high-value connections became increasingly important.
Players who exhausted their trains too early often surrendered strategic flexibility near the end of the game.
Gambling
Drawing new destination tickets late in the game became known simply as gambling.
If the newly drawn destinations overlapped with routes you had already built, the reward could be substantial.
If they didn't, the resulting penalties could destroy an otherwise strong game.
Endgame Control
The player who reduces their remaining train cars to two or fewer initiates the final round.
That gives a player some control over when the game ends.
If you're ahead, accelerating the endgame can prevent opponents from completing additional routes. If you're behind, extending the game may be valuable.
Convincing another player who was close to ending the game to instead draw more destination tickets became a surprisingly effective form of psychological play.

Point Targeting
Players sometimes began targeting thresholds within particular scoring categories.
My own strategy increasingly involved attempting to secure roughly 50 destination-ticket points and then shifting emphasis toward longer train segments.
The idea was to establish a reasonably strong route-scoring base before maximizing the more predictable point efficiency of long connections.
Mindreading
After enough games, we became familiar with many of the 30 destination tickets in the U.S. version.
That meant the routes appearing on the board could provide clues about what another player was trying to accomplish.
Watching someone build toward Miami, Seattle, Los Angeles, New York, or another distinctive endpoint sometimes allowed us to infer which tickets they were likely holding and where they might move next.
The board had become not only a map of completed actions, but a partial representation of each player's hidden objectives.
What I Took From It
None of this transformed Ticket to Ride into a serious scientific model.
It did, however, make a pattern visible that I have kept returning to since:
Observe behavior, decide what to measure, build a representation of it, and then ask what underlying strategy or structure could have produced the pattern you see.
The project began with a spreadsheet because I wanted to know who was winning.
It became much more interesting when the data started forcing me to ask what winning differently meant.
A few months later, I began at Western Washington University, where questions about behavior, expertise, representation, and eventually the brain became much more serious.
Project Files
If any part of this sounds fun, the underlying materials are still available.
- Quick Start Guide
- Cloneable Tournament Spreadsheet
- Cloneable Spreadsheet with Anonymized Sample Data
- Project Drive Folder
- Jupyter Analysis Pipeline
- Ticket to Ride Calculator
And, because apparently this was a necessary endpoint for the project, you can now tell a family member that their Sharpe ratio is too low.